DATA LOGGING OF TWO DIFFERENT SENSORS
I have done data logging system using
MSP430G2 and Python. In this project I tried to plot the real time graph of two
sensors namely LDR (light dependent resistor) and IR (infrared sensor).
Here in this project I am using
matplotlib, numpy, drawnow in the place of drawnow we can use deque for
plotting live graph.
In order to do this project I need to
have a good knowledge of the above mentioned libraries. So ill do some
experiments with these libraries
First of all I need to know how to
plot the graphs and what all the command that are required to plot the graph
with our specifications.
Now ill plot a simple graph using
som
Now I’ll try
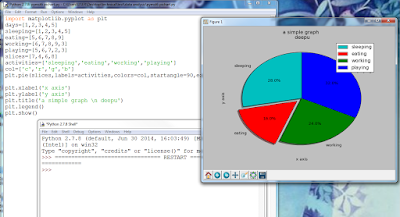
all the different command that are related to graphs, bar charts, pie charts
etc.
Now I’ll try
to import the text file and read the 2 different values which are separated ‘delimiter’
from the text file and plot the graph.
Here ‘delimiter’
is single space
K good! Now I
got enough practice to draw the graph, next my task is to import the continuous
serial values and plot the graph. Before that we need to fallow few step to
attain that.
First of all I need to do check weather can I do any changes
to my serial values.
K good now I
can plot the graph with these continuous added values by using ‘drawnow’.first
ill try to plot for single sensor.
data analysis of 2 sensors (LDR and IR)
here i change the plot label to there specified sensors names so that it will more understandable.


No comments:
Post a Comment